Earlier antiretroviral treatment initiation prevents new HIV
infections. A key problem in HIV prevention and care is the high number of
patients diagnosed late, as these undiagnosed patients can continue forward HIV
transmission. We modeled the impact on the Dutch men-who-have-sex-with-men
(MSM) HIV epidemic and cost-effectiveness of an existing partner notification
process for earlier identification of HIV-infected individuals to reduce HIV
transmission.
Reduction in new infections and cost-effectiveness ratios
were obtained for the use of partner notification to identify 5% of all new
diagnoses (Scenario 1) and 20% of all new diagnoses (Scenario 2), versus no
partner notification. Costs and quality adjusted life years (QALYs) were
assigned to each disease state and calculated over 5 year increments for a 20
year period.
Partner notification is predicted to avert 18–69 infections
(interquartile range [IQR] 13–24; 51–93) over the course of 5 years countrywide
to 221–830 (IQR 140–299; 530–1,127) over 20 years for Scenario 1 and 2
respectively. Partner notification was considered cost-effective in the short
term, with increasing cost-effectiveness over time: from €41,476 -€41, 736 (IQR
€40,529-€42,147; €40,791-€42,397) to €5,773 -€5,887 (€5,134-€7,196;
€5,411-€6,552) per QALY gained over a 5 and 20 year period, respectively. The
full monetary benefits of partner notification by preventing new HIV infections
become more apparent over time.
Partner notification will not lead to the end of the HIV
epidemic, but will prevent new infections and be increasingly cost-effectiveness
over time.
Below: Cumulative
infections averted over 20 years. Scenario 1 in which 5% of patients are
diagnosed through the online partner notification system (in red, median and
interquartile range). Scenario 2 in which 20% of patients are diagnosed through
the online partner notification system (in green, median and interquartile
range). Graph A is when treatment is initiated at a CD4 cell count <500
cells/μl. Graph B is when treatment is initiated immediately.
Below: Cost per quality
adjusted life year (QALY) gained over time in 5 year increments. Scenario
1 in which 5% of patients are diagnosed through partner notification (Graph A
when treatment is started a CD4 cell count <500 cells/μl, Graph C when
treatment is initiated immediately). Scenario 2 in which 20% of patients are
diagnosed through partner notification. Graph A is when treatment is initiated
at a CD4 cell count <500 cells/μl. Graph B is when treatment is initiated
immediately (Graph B when treatment is started a CD4 cell count <500
cells/μl, Graph D when treatment is initiated immediately).
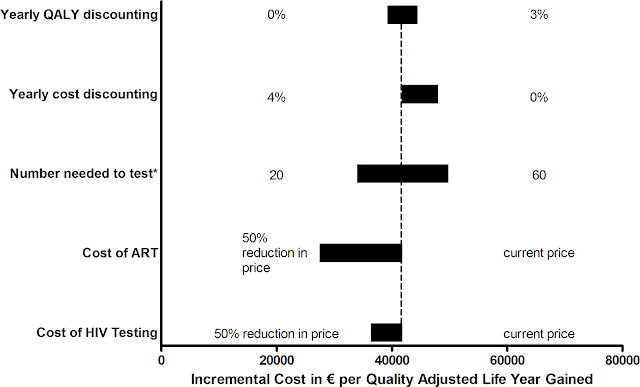
Below: One-way sensitivity analyses of the incremental
cost-effectiveness ratio of using the partner notification system over 5 years
in Scenario 1 in which 5% of patients are diagnosed via the online partner
notification system. Each horizontal bar represents the full range of
cost-effectiveness ratios produced by varying a given model parameter across
its plausible range. The vertical dotted line represents the incremental cost-effectiveness
ratio in Scenario 1 over 5 years in the primary analysis (€41,736 per QALY
gained).
Full article at: http://goo.gl/5u819F
By:
Brooke E. Nichols, Eric C. M. van Gorp, Charles A. B.
Boucher, David A. M. C. van de Vijver
Department of Viroscience, Erasmus Medical Center,
Rotterdam, the Netherlands
Hannelore M. Götz
Department Infectious Disease Control, Public Health Service
Rotterdam-Rijnmond, Rotterdam, the Netherlands
Hannelore M. Götz
Department of Public Health, Erasmus Medical Center,
Rotterdam, the Netherlands
Eric C. M. van Gorp, Annelies Verbon, Casper Rokx
Department of Internal Medicine and Infectious Diseases,
Erasmus Medical Center, Rotterdam, the Netherlands
More at: https://twitter.com/hiv_insight


No comments:
Post a Comment