This pragmatic study examines
love as a mode of communication. Our focus is on the receiver side: what makes
an individual feel loved and how felt love is defined through daily interactions.
Our aim is to
explore everyday life scenarios in which people might experience love, and to
consider people’s converging and diverging judgments about which scenarios
indicate felt love. We apply a cognitive psychometric approach to quantify a
receiver’s ability to detect, understand, and know that they are loved.
Through
crowd-sourcing, we surveyed lay participants about whether various scenarios
were indicators of felt love. We thus quantify these responses to make inference
about consensus judgments of felt love, measure individual levels of agreement
with consensus, and assess individual response styles. More specifically, we
- derive consensus judgments on felt love;
- describe its characteristics in qualitative and quantitative terms,
- explore individual differences in both
- participant agreement with consensus, and
- participant judgment when uncertain about shared knowledge, and
- test whether individual differences can be meaningfully linked to explanatory variables.
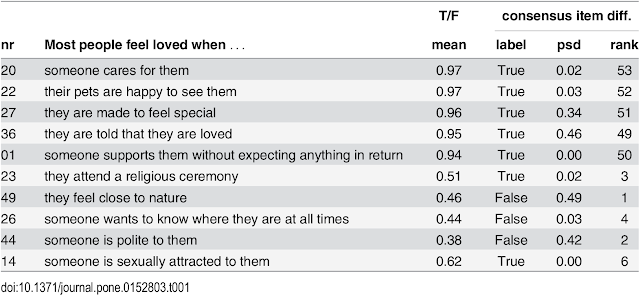
Below: Raw data means and model
based estimates on selected felt love items.
The second columns shows the mean of the answers for the
item with ‘True’ coded as 1 and ‘False’ as 0. The posterior distribution on the
consensus parameters for each item is summarized in columns 3 and 4, in terms
of posterior median estimate, labeled as ‘True’ for 1 and ‘False’ for 0 and
posterior standard deviation (abbreviated as ‘psd’). It quantifies standard
error around the point estimate. The last column shows the item difficulty rank
of the item in ascending order.
Full article at: http://goo.gl/kv3TUC
By:
Human Development and Family Studies, The Pennsylvania State University, State College, PA, United States of America
Cognitive Sciences, University of California Irvine, Irvine, CA, United States
of America
More at: https://twitter.com/hiv insight

No comments:
Post a Comment