In this paper we estimate the
size of weekend effects for seven emotions and then explore their main
determinants for the working population in the United States, using the
Gallup/Healthways US Daily Poll 2008–2012. We first find that weekend effects
exist for all emotions, and that these effects are not explained by sample
selection bias. Full-time workers have larger weekend effects than do part-time
workers. We then explore the sources of weekend effects and find that workplace
trust and workplace social relations, combined with differences in social time
spent with family and friends, together almost fully explain the weekend
effects for happiness, laughter, enjoyment and sadness, for both full-time and
part-time workers, with significant but smaller proportions explained for the
remaining three emotions—worry, anger and stress. Finally, we show that
workplace trust and social relations significantly improve emotions and life
evaluations on both weekends and weekdays for all workers.
Below: Propensity Score. Notes: The upper panel of Fig 1
shows the distribution of propensity scores for people who were actually
interviewed on weekends and weekdays, and the lower panel shows the
distribution of propensity scores for people who report emotions for weekends
(who were interviewed on Sunday and Monday) and weekdays (who were interviewed
on Tuesday to Saturday).
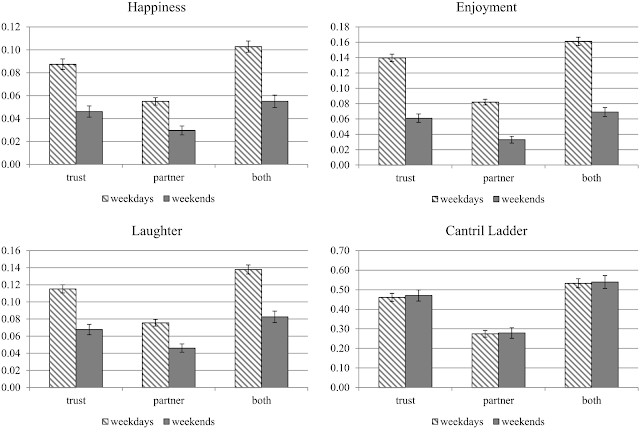
Below: Impacts of Workplace Environment on Positive Emotions and Life
Evaluations on Weekends and Weekdays—Full-time Workers. Notes: The vertical bars indicated by “trust” show the
difference in positive emotions or life evaluations between those reporting
“trusting workplace” and those reporting “non-trusting workplace”. The bars
indicated by “partner” show the difference between those reporting
“partner-like supervisor” and those reporting “boss-like supervisor”. The bars
indicated by “both” show the difference between those reporting both “trusting
workplace” and “partner-like supervisor” and those reporting “non-trusting
workplace” and “boss-like supervisor”. 95% confidence interval is also shown
for each bar.
Below: Impacts of Workplace Environment on Negative Emotions on
Weekends and Weekdays—Full-time Workers. Notes: The vertical bars indicated by
“trust” show the difference in negative emotions between those reporting
“trusting workplace” and those reporting “non-trusting workplace”. The bars
indicated by “partner” show the difference between those reporting “partner-like
supervisor” and those reporting “boss-like supervisor”. The bars indicated by
“both” show the difference between those reporting both “trusting workplace”
and “partner-like supervisor” and those reporting “non-trusting workplace” and
“boss-like supervisor”. 95% confidence interval is also shown for each bar.
Full article at: http://goo.gl/46zQXW
By:
John F. Helliwell
Vancouver School of Economics,
University of British Columbia, Vancouver, British Columbia, Canada
John F. Helliwell
Canadian Institute for Advanced
Research (CIFAR), Toronto, Ontario, Canada
Shun Wang
Korea Development Institute
(KDI) School of Public Policy and Management, Sejong, Korea
More at: https://twitter.com/hiv_insight


No comments:
Post a Comment