Control of sexually
transmitted infections and blood-borne pathogens is challenging due to their
presence in groups exhibiting complex social interactions. In particular,
sharing injection drug use equipment and selling sex (prostitution) puts people
at high risk. Previous work examining the involvement of risk behaviours in
social networks has suggested that social and geographic distance of persons
within a group contributes to these pathogens’ endemicity. In this study, we
examine the role of place in the connectedness of street people, selected by
respondent driven sampling, in the transmission of blood-borne and sexually
transmitted pathogens.
A sample of 600 injection drug users, men who have sex with men, street youth and homeless people were recruited in Winnipeg, Canada from January to December, 2009. The residences of participants and those of their social connections were linked to each other and to locations where they engaged in risk activity.
Survey responses identified 101 unique sites where respondents participated in injection drug use or sex transactions. Risk sites and respondents’ residences were geocoded, with residence representing the individuals. The sociospatial network and estimations of geographic areas most likely to be frequented were mapped with network graphs and spatially using a Geographic Information System (GIS).
The network with the most nodes connected 7.7% of respondents; consideration of the sociospatial network increased this to 49.7%. The mean distance between any two locations in the network was within 3.5 kilometres. Kernel density estimation revealed key activity spaces where the five largest networks overlapped. Here, the combination of spatial and social entities in network analysis defines the overlap of vulnerable populations in risk space, over and above the person to person links.
Implications of this work are far reaching, not just for understanding transmission dynamics of sexually transmitted infections by identifying activity “hotspots” and their intersection with each social network, but also for the spread of other diseases (e.g. tuberculosis) and targeting prevention services.
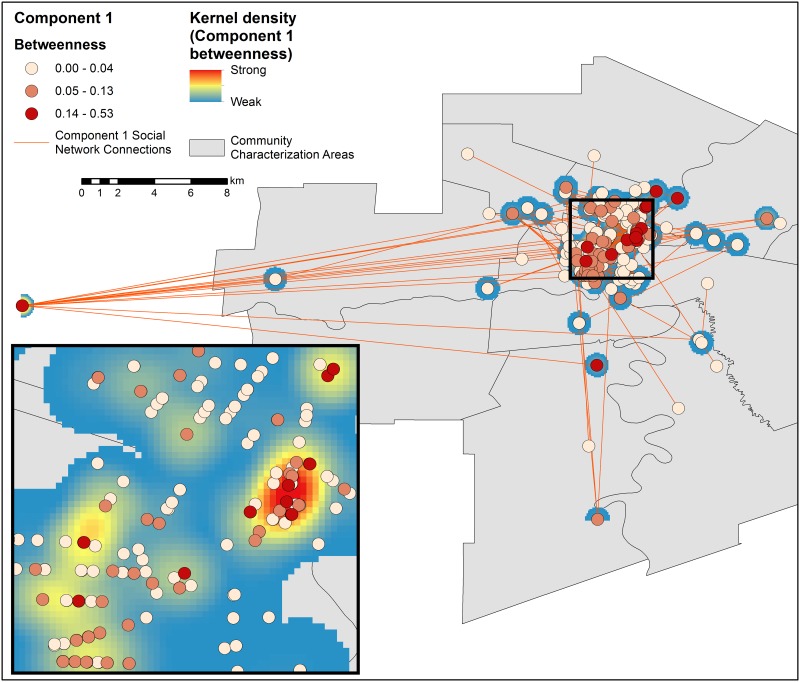
Below: Geographic extents of Component 1 (n = 366). Points, demonstrating spatial distribution of residences and risk activity sites, are colored by betweenness centrality scores. The KDE surface for Component 1 is calculated by weighting the betweenness scores in the sociospatial network. (Created using ArcGIS 10.2 [27]. Community Characterization Area base layer obtained from the City of Winnipeg’s Open Data Catalog [28].)
A sample of 600 injection drug users, men who have sex with men, street youth and homeless people were recruited in Winnipeg, Canada from January to December, 2009. The residences of participants and those of their social connections were linked to each other and to locations where they engaged in risk activity.
Survey responses identified 101 unique sites where respondents participated in injection drug use or sex transactions. Risk sites and respondents’ residences were geocoded, with residence representing the individuals. The sociospatial network and estimations of geographic areas most likely to be frequented were mapped with network graphs and spatially using a Geographic Information System (GIS).
The network with the most nodes connected 7.7% of respondents; consideration of the sociospatial network increased this to 49.7%. The mean distance between any two locations in the network was within 3.5 kilometres. Kernel density estimation revealed key activity spaces where the five largest networks overlapped. Here, the combination of spatial and social entities in network analysis defines the overlap of vulnerable populations in risk space, over and above the person to person links.
Implications of this work are far reaching, not just for understanding transmission dynamics of sexually transmitted infections by identifying activity “hotspots” and their intersection with each social network, but also for the spread of other diseases (e.g. tuberculosis) and targeting prevention services.
Below: Geographic extents of Component 1 (n = 366). Points, demonstrating spatial distribution of residences and risk activity sites, are colored by betweenness centrality scores. The KDE surface for Component 1 is calculated by weighting the betweenness scores in the sociospatial network. (Created using ArcGIS 10.2 [27]. Community Characterization Area base layer obtained from the City of Winnipeg’s Open Data Catalog [28].)
Below: Spatial extents of the five
largest sociospatial network components.
The intersection of components 1 (orange), 2 (blue), 3
(green), 7 (purple) and 29 (brown) and a density ‘heat map’ of all risk
activity locations illustrates where each component presents risk. (Created
using ArcGIS 10.2 [27].
Community Characterization Area base layer obtained from the City of Winnipeg’s
Open Data Catalog [28].)

Full article at:

Full article at:
By:
Mark Stoove, Editor
1School of Epidemiology, Public Health and
Preventative Medicine, University of Ottawa, Ottawa, Ontario, Canada
2Department of Geography, Dutton Institute
of e-Education and GeoVISTA Center, The Pennsylvania State University,
University Park, Pennsylvania, United States of America
Burnet Institute,
AUSTRALIA
#Contributed equally.
Competing Interests: The authors have declared that no
competing interests exist.
Conceived and designed the experiments: JJL AMJ
JIB. Performed the experiments: JJL AMJ JIB. Analyzed the data: JJL AMJ JIB.
Wrote the paper: JJL AMJ JIB.
* E-mail: moc.liamg@nagol.yaj
More at: https://twitter.com/hiv insight

No comments:
Post a Comment